[¹] including delivered vehicles built locally by associated Chinese companies
[²] Investments in property, plant and equipment, investment property and other intangible assets according to cash flow statement in relation to revenue
[¹] including delivered vehicles built locally by associated Chinese companies
[²] Investments in property, plant and equipment, investment property and other intangible assets according to cash flow statement in relation to revenue
The non-financial indicator of deliveries to customers reflects the number of new automotive vehicles of the Brand Group (Audi, Lamborghini & Bentley) handed over to customers.
| Deliveries to customers | Compared with the prior-year level | deliveries to customers accumulated | Accumulated compared with the prior-year level | |
|---|---|---|---|---|
| First quarter 2024 | 402,048 | -4.7 % | – | – |
| Second quarter 2024 | 441,943 | -11.2 % | 843,991 | -8.2 % |
| Deliveries of the Brand Group [¹] | Compared with the prior-year level | Deliveries of the Brand Group, accumulated YTD [¹] | Accumulated compared with the prior-year level | |
|---|---|---|---|---|
| January 2023 | 116,200 | -15.2 % | – | – |
| February 2023 | 127,100 | +16.0 % | 243,300 | -1.4 % |
| March 2023 | 178,500 | +23.9 % | 421,800 | +7.9 % |
| April 2023 | 149,600 | +43.7 % | 571,400 | +15.5 % |
| May 2023 | 163,700 | 19.5 % | 735,100 | +16.3 % |
| June 2023 | 184,400 | +11.3 % | 919,500 | +15.3 % |
| July 2023 | 158,000 | +14.1 % | 1,077,500 | +15.1 % |
| August 2023 | 149,900 | +13.2 % | 1,227,500 | +14.9 % |
| September 2023 | 177,400 | +23.4 % | 1,404,800 | +15.9 % |
| October 2023 | 154,100 | +15.4 % | 1,559,000 | +15.8 % |
| November 2023 | 171,700 | +26.3 % | 1,730,200 | +16.8 % |
| December 2023 | 188,700 | +20.3 % | 1,918,900 | +17.1 % |
| Deliveries of the Brand Group [¹] | Compared with the prior-year level | Deliveries of the Brand Group, accumulated YTD [¹] | Accumulated compared with the prior-year level | |
|---|---|---|---|---|
| January 2022 | 137,100 | -12.4% | – | – |
| February 2022 | 109,500 | -10.6% | 246,700 | -11.6% |
| March 2022 | 144,100 | -22.6% | 390,800 | -16.0% |
| April 2022 | 104,100 | -39.5% | 495,000 | -22.3% |
| May 2022 | 137,000 | -20.4% | 632,000 | -21.9% |
| June 2022 | 165,600 | -6.5% | 797,600 | -19.2% |
| July 2022 | 138,500 | -6.1% | 936,100 | -17.5% |
| August 2022 | 132,400 | +12.5% | 1,068,500 | -14.6% |
| September 2022 | 143,800 | +39.9% | 1,212,300 | -10.5% |
| October 2022 | 133,600 | +34.9% | 1,345,900 | -7.4% |
| November 2022 | 135,900 | +24.3% | 1,481,800 | -5.2% |
| Dezember 2022 | 156,900 | +24.5% | 1,638,600 | -3.0% |
| Key performance indicators | Forecast 2024 |
|---|---|
| Deliveries of cars of the brand group to customers | between 1.7 and 1.9 million vehicles |
| Revenue | between EUR 63 and 68 billion |
| Operating return on sales | update: between 6 and 8 percent |
| Net cash flow | between EUR 2.5 and 3.5 billion |
| Investment ratio [¹] | between 11 and 13 percent |
[¹] The investment ratio describes research and development activities and capex as a proportion of revenue.
[¹] The investment ratio describes research and development activities and capex as a proportion of revenue.
The basis for the management of the Brand Group is a value-oriented corporate management approach in combination with the following key performance indicators, which are important drivers of our corporate development and support the goals of our strategy.
Deliveries to customers of the Brand Group ProgressiveThe non-financial indicator of deliveries to customers reflects the number of new vehicles of the Brand Group Progressive handed over to customers. This performance indicator reflects demand from customers for our products and reveals our competitive and image position in the various markets worldwide. Strong demand for our products has a major impact on production, and consequently also on the capacity utilization of our sites and the deployment of our workforce. In addition, a continuing high level of vehicle deliveries reflects high customer satisfaction.
The financial key performance indicators include revenue of the Audi Group, which is a financial reflection of our market success.
Operating profit / operating return on salesAnother key performance indicator is the operating profit of the Audi Group. This key figure represents the economic performance of our core business as well as the economic performance of our fundamental operational activity, and is defined as follows:
– Cost of goods sold
+ Other operating income
– Other operating expenses
= Operating profit
Our financial key performance indicators also include the operating return on sales of the Audi Group:
Operating return on sales = Operating profit / Revenue
Return on investment (ROI)A further key performance indicator is return on investment (ROI). This reflects how effective our business activities are, by considering the return achieved on the capital employed over a given period. Return on investment already takes account of CO₂ compliance measures and can therefore also be understood as return on investment after CO₂.
Return on investment (ROI) = Operating profit after tax / Average invested assets
Net cash flowNet cash flow, which serves as a benchmark of the Audi Group’s level of self-financing, is calculated as follows:
Cash flow from operating activities
– Investing activities attributable to operating activities
= Net cash flow
Research and development ratioThe research and development ratio expresses Audi’s innovative strength and also ensures that it maintains competitive cost structures.
Research and development ratio = Research and development activities / Revenue
Capex ratioThe capex ratio is another indicator of the Audi Group’s competitiveness.
Capex ratio = Capex according to the cash flow statement / Revenue
Capex includes investments in property, plant and equipment, investment property and other intangible assets according to the cash flow statement. Here, capital investment in essence comprises financial resources for modernizing and expanding our range of products and services, for optimizing our capacities and for improving the Audi Group’s production processes. Investment decisions are requested by the specialist areas, then scrutinized and prioritized by Investment Controlling and the “Investment Group” corporate committee. Major decisions affecting investment policy are also approved by the Company’s Supervisory Board.
Annual and sustainability report
Welcome to the Audi Report 2023! The combined annual and sustainability report of Audi brings together the topics of strategy, finance as well as Environmental, Social and Governance (ESG).
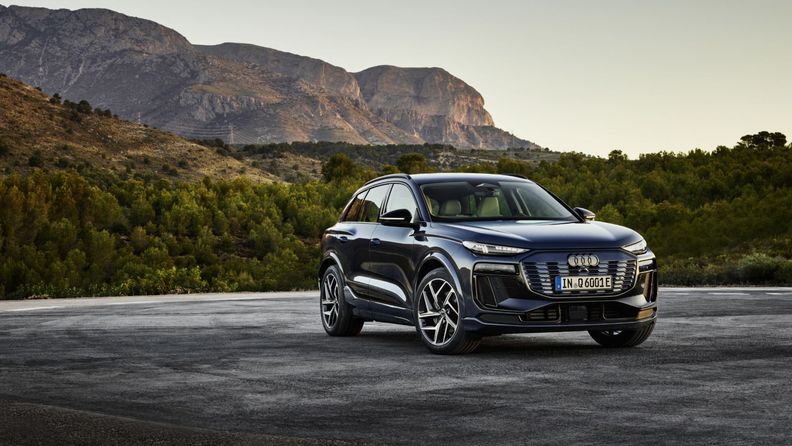
Audi Q6 e-tron quattro: electric power consumption (combined): 19.6–17.0 kWh/100 km; CO₂ emissions (combined): 0 g/km; CO₂ class: A
Audi Q6 e-tron quattro: electric power consumption (combined): 19.6–17.0 kWh/100 km; CO₂ emissions (combined): 0 g/km; CO₂ class: A